NetConfer: A Graphical Summary
○
Graphical Overview of NetConfer
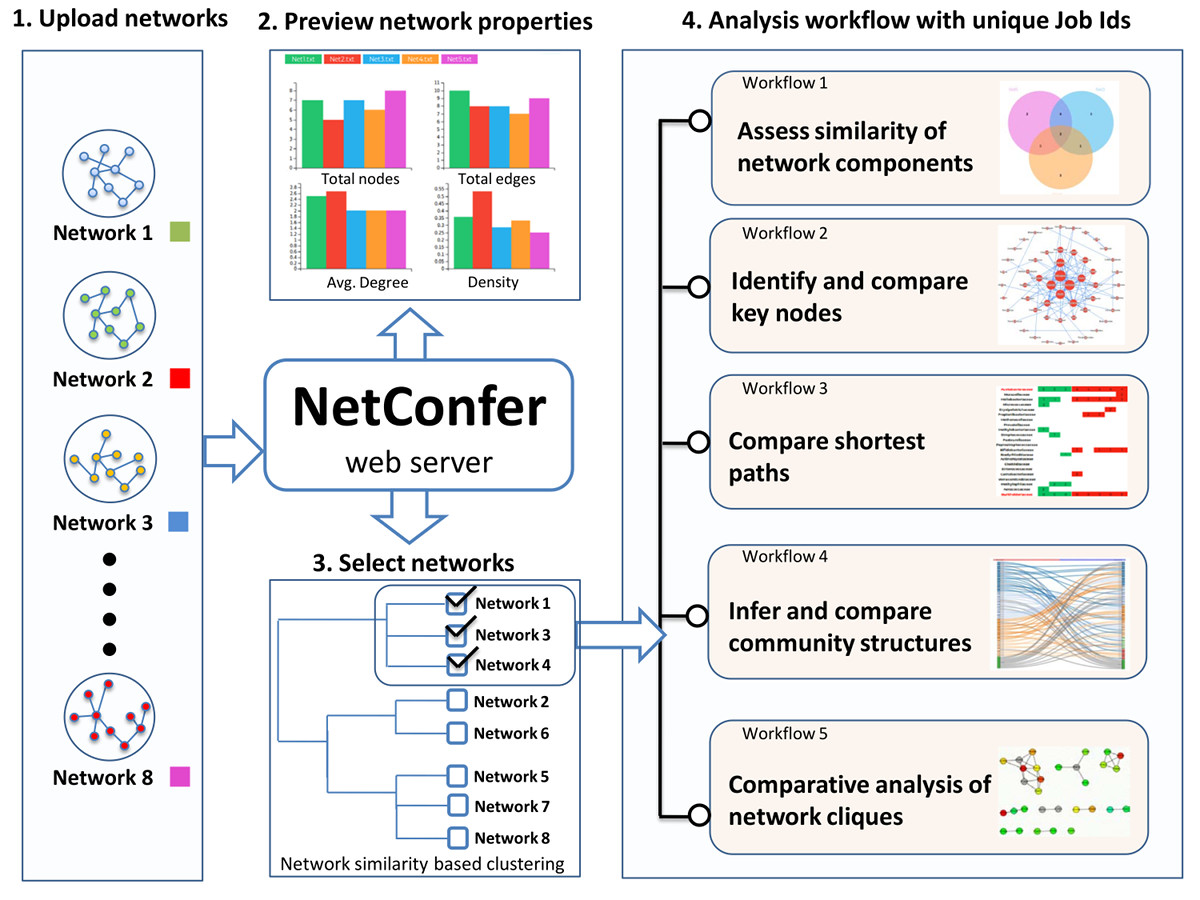
NetConfer allows comparison of multiple interaction networks using various methodologies organized as ‘analysis workflows’. The uploaded networks are automatically clustered based on their overall similarity and presented to the user for ease of selection. Each workflow can then be applied over a user selected set of networks for further analysis. Various workflows focus on comparative analysis of nodes, edges, graph properties, shortest paths, community structures and network cliques. Please refer to the documentation and tutorial section for more details.
A brief description of the individual workflows is presented below.
NetConfer Workflows
○
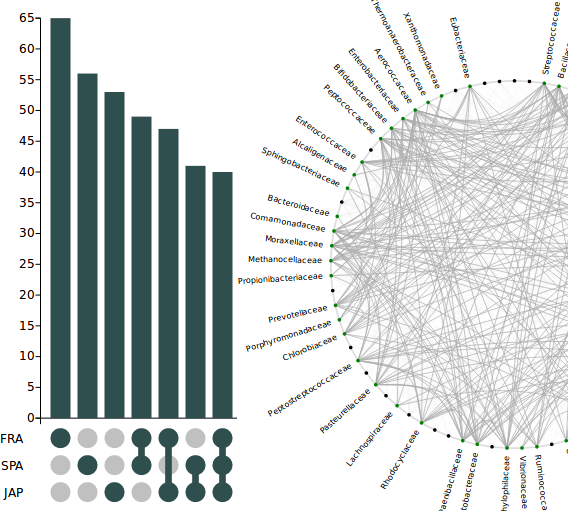
Workflow 1: Assess similarity of network components
This workflow identifies nodes/edges which are commonly shared or exclusive to one or more of the selected set of networks. It uses a powerful visualization technique called ‘upset plot’ augmented with interactive user operations to graphically display the similarities and differences.
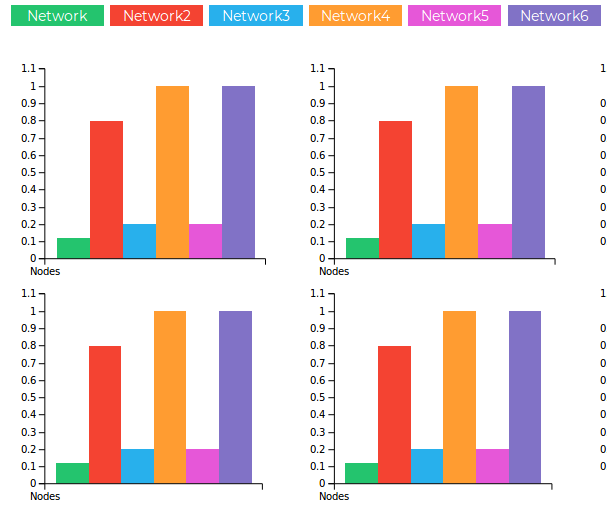
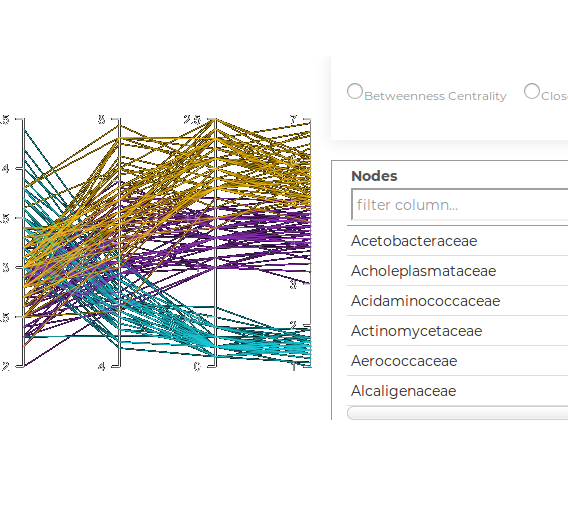
Workflow 2: Identify and compare key nodes
This workflow allows identification and comparison of key nodes between selected networks using local graph property measures. For an ordered selection, a ‘delta centrality’ calculation is made to identify discriminating nodes and displayed using parallel coordinates.
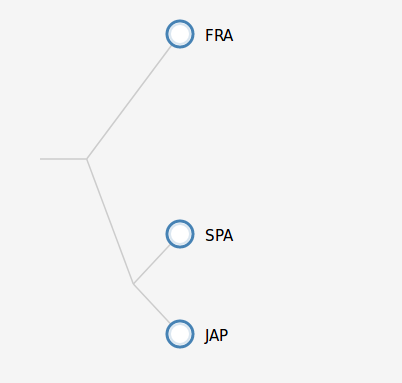
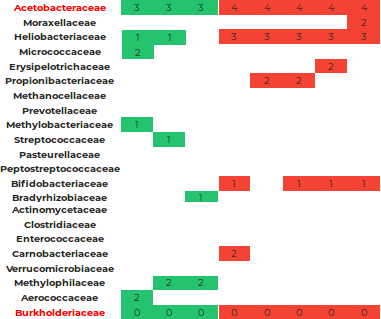
Workflow 3: Compare shortest paths
This workflow allows performing a comparative analysis of shortest paths between a given pair of nodes across a selected set of networks. The output is presented graphically for identification of critical nodes in information flow.
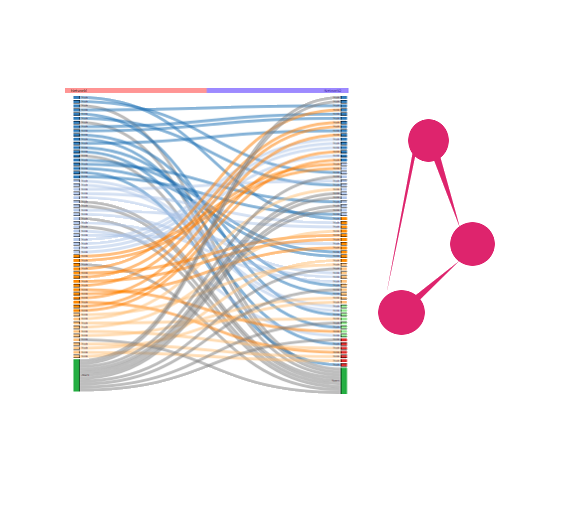
Workflow 4: Infer and compare community structures
This workflow is designed to identify and capture changes in community structure (densely connected group of nodes) across the selection. Communities are inferred using Newman and Louvain algorithms. A ‘sankey plot’ is used to represent changes in communities between a set of selected networks.
Workflow 5: Analysis and comparison of network cliques:
This workflow is designed to find and compare ‘cliques’ (closely knit subset of nodes in a graph) between networks. Cliques can be useful in several biological systems like identification of co-expressed genes, finding (and comparing) motifs or analyzing microbial communities.