NetShift

Identification of driver nodes between case-control association networks

Select from a list of examples

Gut microbiome comparison in Allergic asthma with healthy controls
Oral microbiome (saliva) in HIV infected vs healthy individuals
Oral microbiome (plaque) in HIV infected vs healthy individuals

To compare more than two networks (i.e. more than two states like 'disease', 'control', 'treatment 1', 'treatment 2', etc.), please use our new tool NetConfer available at https://web.rniapps.net/netconfer

Upload Case and Control association networks


Select CASE network (Tab delimited edge list)

Select CONTROL network (Tab delimited edge list)

Please note that due to server limitations, we are currently limiting 'case' and 'control' network file upload size to maximum 50kB (typically upto 1000 edges).


Please verify the captcha
Validation success
Validation failed


Details

The combined effect of mutual associations within the co-inhabiting microbes in human body is known to play a major role in determining our health status. The differential taxonomic abundance between a healthy and disease state are often used to identify microbial markers. However, in order to make a microbial community based inference, it is important not only to consider microbial abundances, but also quantify the changes observed among inter microbial associations. We introduce a method called ‘NetShift’ to visualize community shufflings in microbial association networks between healthy and diseased states and identify 'driver' nodes observed between the states. The ‘NetShift’ web server allows easy visual analysis of ‘case’ and ‘control’ microbial association networks requiring users to simply upload the corresponding networks as edge lists. All results are presented as user friendly and interactive charts/tables allowing easy biological inferences. A summary of the algorithm is shown in the figures below.
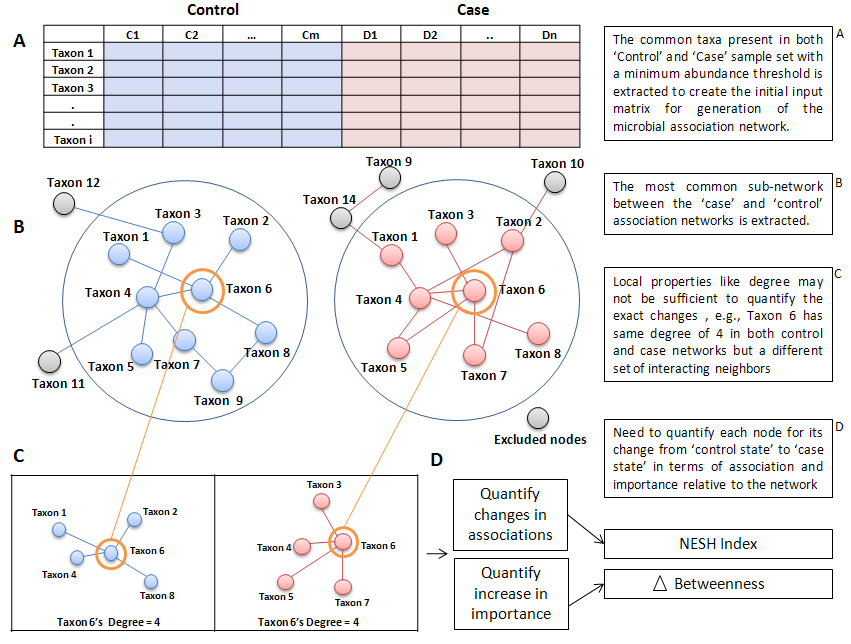
Algorithm

Contact

For any queries/troubleshoot or bug report please direct your mails to kuntal.bhusan@tcs.com. This tool is free for academic use. Commercial users please contact sharmila.mande@tcs.com.

Citation

Kuntal, B.K., Chandrakar, P., Sadhu, S. et al. ‘NetShift’: a methodology for understanding ‘driver microbes’ from healthy and disease microbiome datasets. ISME J 13, 442–454 (2019). https://doi.org/10.1038/s41396-018-0291-x

Other related tools of interest

Compare multiple networks (standalone) : CompNet

Compare multi state networks (web based) : NetConfer

Venn diagram based fast network comparison (web based): NetSets

Time series microbiome data analysis (web based): TIME

Model microbiome time series data (web based): Web-gLV

Microbiome community network analysis (standalone): Community-Analyzer

Visualize multivariate data without feature decomposition (web based): Igloo-plot

Disclaimer

"NETSHIFT" SOFTWARE TOOL IS NOT INTENDED TO BE USED FOR TREATING OR DIAGNOSING HUMAN SUBJECTS.

"NETSHIFT" or any documents available from this server ARE PROVIDED AS IS WITHOUT ANY WARRANTY OF ANY KIND, EITHER EXPRESS, IMPLIED, OR STATUTORY, INCLUDING, BUT NOT LIMITED TO, ANY IMPLIED WARRANTIES OF MERCHANTABILITY, FITNESS FOR A PARTICULAR PURPOSE AND FREEDOM FROM INFRINGEMENT, OR THAT "NETSHIFT" or any documents available from this server WILL BE ERROR FREE.

In no event will the authors, their employers or any of the lab/office members be liable for any damages, including but not limited to direct, indirect, special or consequential damages, arising out of, resulting from, or in any way connected with the use of "NETSHIFT" or documents available from this server.

The authors will try their best to maintain the privacy and confidentiality of the uploaded user data and will not use the data for any work directly or indirectly except for software debugging purpose.