
The following steps gives a complete walk-through of using OTUX database for taxonomic classification.
- Pre-requisites
- Downloading OTUX database
- Performing reference based OTU-picking/ taxonomic classification with mothur
- Parsing mothur outputs to generate abundance profiles
- Visualization of taxonomies
- Cross-comparison of results using Greengenes IDs
For any reference based OTU-picking or taxonomic classification approach one requires the following prerequisites
- Reference database: We will use an appropriate OTUX database for this walk-through
- A taxonomic classification algorithm/tool: For this walk-through we will be using the Wang's algorithm [1] as implemented in the Mothur project [2]. Additionally, a few more algorithms are implemented in mothur project for taxonomic classification. You may go through the list on this page as provided by the authors of mothur.
- An input file: The input file contains sequence reads in fasta format. Ideally one should preprocess the input file by extracting the targetted v-region from the sequence reads using v-region extraction tools (example: vxtractor [3]). For this walk-through we will use the fasta file named ‘sample_V4.fasta’, containing sequences of reads targetted for V4 region. A preview of this file is mentioned below.
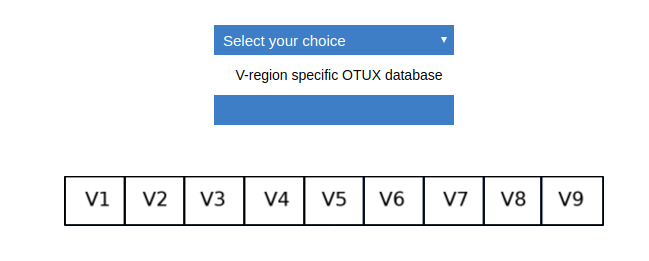
OTUX provide a set of databases (19) each covering a V-regions (or stretches of V-regions) from 16S rRNA. The regions commonly targetted in amplicon sequencing are included in this database. Download the database corresponding to the targetted region of your input sequence reads. In case the V-region database of your choice is not available please contact us.
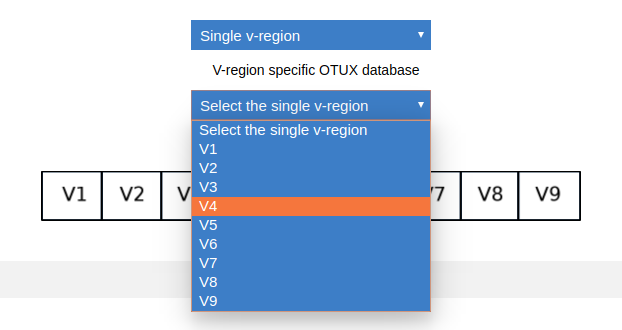
Since the reads in ‘sample.fasta’ was sequenced targetting V4 regions, for this walk-through we will require the OTUX database of V4 region as reference. You need to go the download page. Select single V-region from the first dropdown.
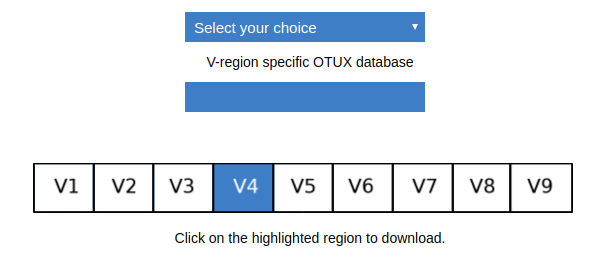
Select V4 from the second dropdown.
Once the V4 region is highlighted, you need to click on the same to download the V4 database.
An archived folder is downloaded which has following files:
- FASTA file of containing sequences consituting the V4 regions corresponding to OTUX OTU IDs
- Taxonomy file of V4 database, which provides sequence wise taxonomic information along with the OTUX IDs
- A mapping-back matrix for V4 database (required for mapping back the OTUX IDs obtained in the abundance profiles to Greengenes IDs [4]). Please refer to this page for detailed information about mapping-back matrices.
For help regarding downloading a database belonging to any other V-region or a stretch of V-regions please refer to this page
Before starting OTU-picking make sure the database (fasta file and taxonomy file) and input fasta file are located in the same directory where you want to execute mothur command. Enter the mothur environment by typing ‘./mothur’ in the terminal in case you are using the executable. Whereas, you may directly type 'mothur' in case you have installed mothur on your computing device. For any help regarding installing mothur on your device please follow the instructions provided by the authors of mothur at this link. Once you enter the mothur environment you will see this.
In the mothur environment enter the following command
The provided parameters which are required for running the above command are explained below.
- fasta: your input fasta file
- template: fasta file of the reference database. OTUX V4 database in this case.
- taxonomy: taxonomy file of the reference database.
- processors: number of processors/ cores of the computing machine on which you want to run this command. In this example we have used a single core.
* Please note these cores will be used only for classifying sequences from input fasta file. Only one core will be used for loading the database in the memory. During first run mothur builds few files which stores information pertaining to 8mer probabilities (required by Wang‘s method). However, this is a one time time process and for future runs mothur loads these template probabilities into the memory. - cutoff: The Wang"s algorithm divides the query sequences into 8mers and calculates the probability a sequence from a given taxonomy would contain a specific 8mer by looking at all taxonomies represented in the template. It then calculates probability of the query sequence of being assigned to a taxonomy based on the 8mers it contains. The taxonomy with highest probability is assigned. Apart from this, Wang‘s algorithm also performs bootstrapping to find the confidence limit of taxonomic assignment by randomly picking 1/8 of the 8mers (with replacement) in the query and then finding the taxonomy. To pick taxonomic assignments with high confidence we provide a cutoff/ threshold value. By default this value is 80% which is the conventional norm followed in RDP classifier.
For more details regarding the sequence classification option in mothur please refer to their help page.
The mothur software will generate two output files,
- A taxonomy file. The following gives a preview of taxonomy file generated for the input file used in this walk-through.
- A tax summary file which gives consolidated summary of the taxonomic classification. The summary of first OTUX ID OTX040004433 in the tax summary file, generated in this walk-though, is shown below.
The taxonomy file generated by mothur, named ‘sample_V4.otux.wang.taxomomy’, is parsed using the scripts provided by us on the download page. Before running the script, please make sure that the script and the required input files are present in the same directory. The script was tested for mothur output generated by the version v.1.39.5 last updated on 3/20/2017.
** The mapping back file to be used above is being downloaded along with database. Whereas, the greengenes taxonomy file, which is required to map back the taxonomies obtained using OTUX to Greengenes taxonomies, can be downloaded from the download page.
Running this script generates,
- OTUX abundance profiles at each taxonomic level. One set gives the raw count of abundances while the other set gives percentage normalized values.
-
Mapped back abundance profiles from OTUX IDs to Greengenes IDs using one-to-one as well as one-to-many mapping back schemes.
In one-to-one mapping back scheme one OTUX ID is mapped back to one Greengenes ID (which is the best representation of that OTUX ID), whereas in one-to-many mapback scheme, the OTUX ID is mapped back to multiple Greengenes IDs. Please go through this help page to know the details pertaining to mapping back of OTUX IDs to greengenes IDs. - A fasta file which contains sequences which remained unclassified at OTU level using OTUX V4 database. This file can be used to facilitate ‘open reference based OTU picking’. One can use de novo clustering tools like CD-HIT [5] or CROP [6] to cluster these sequences.
- A file in json format which stores the generated taxonomy in a structured way. This file may be used for visualization of taxonomic profiles using D3 library.
These results are stored in a structured way (as shown in the figure below) in a directory which includes the prefix of the input file name followed by the current time.
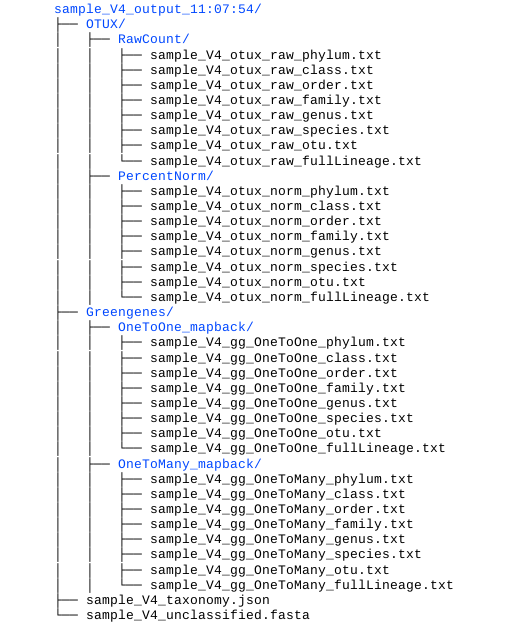
The following section will give a directory-wise preview of each abundance profile. You may download the complete file by clicking on the respective links given above each preview.
1. OTUX
1.1. Raw Count
The taxonomies are assigned according to OTUX nomenclature. The abundances are represented as raw count values.
|
|
|
|
|
|
|
|
|
|
|
1.2. Percentage Normalized
The taxonomies are assigned according to OTUX nomenclature. The abundances are represented as percentage normalized values.
|
|
|
|
|
|
|
|
|
|
|
2. Greengenes
2.1. One-to-one mapping back
The taxonomies shown below are obtained by following the one-to-one mapping back scheme of OTUX IDs to Greengenes IDs. Please note that only those sequences will be mapped back to Greengenes OTU identifiers which have been assigned till OTU level .
|
|
|
|
|
|
|
|
|
|
|
2.2. One-to-many mapping back
The taxonomies shown below are obtained by following the one-to-many mapping back scheme of OTUX IDs to Greengenes IDs. The values are percentage normalized. Please note that only those sequences will be mapped back to Greengenes OTU identifiers which have been assigned till OTU level .
|
|
|
|
|
|
|
|
|
|
|
Few sequences remained unclassified at OTU level using OTUX V4 database. A fasta file was created which can be used to facilitate ‘open reference based OTU picking’ using tools like CD-HIT or CROP.
One can visualize the taxonomies by uploading the json file on the visualization page. Following options are available for visualization. Click on any one of the images to expand.
Please note that a copy of json file will be generated as one of the output files. However you need to have a D3 library installed to visualize the same.
| Hierarchical Bar Chart | Zoomable Circle Packing | Zoomable Sunburst |
|---|---|---|
A brief description of the visualizations is given below.
-
Hierarchical Bar Chart: Each bar represents a taxonomic level. The bar chart starts with the highest taxonomic level, i.e, phylum. The length of the bar is determined by the abundance of that taxa. On has to click on any bar to expand and go to the daughter level of the represented taxa. To go to the parent level click on the white space next to the bars.
Source: Mike Bostock's Block available at this link. -
Zoomable Circle Packing: Each taxa level is represented by a circle. Circle representing parent level taxa contains the circles reprenting its daughter levels in a heirarichal manner. Each circle can be zoomed into by clicking on the same.
Source: Mike Bostock's Block available at this link. -
Zoomable Sunburst: Each taxa level is present as concentric circles with the innermost circle being the highest taxonomy. At a time only two levels are shown. For a taxa with greater abundance, the represented area of that taxa in that concentric circle will be higher. To zoom in on the taxa level (go to daughter levels) on has to click on the represented area. To zoom out (go to parent level) one has to click on the innermost circle.
Source: Vasco Asturiano's Block available at this link.
In the above steps we gave a detailed walk-through of obtaining abundance profile of the sample.fasta file (having reads targetted for V4 region) at each taxonomic level in terms of greengenes IDs. Suppose you want to compare your results with any other study which targetted V2V3 region (download results of this example study) you can use the abundance profiles of OTUX IDs to get abundance profiles in terms of greengenes taxonomy.
Abundance profiles for each taxa level will also be generated. Using these abundance profiles you can compare the results of the two studies.
Calculating Unifrac distance [7] is one of the methods which can be used to compare microbial communities.
Please note that OTUXv2 approach follows the same steps as mentioned above. Only the FASTA, taxonomy and mapping files are to be changed.
- Wang, Q., Garrity, G.M., Tiedje, J.M. and Cole, J.R. (2007) Naive Bayesian classifier for rapid assignment of rRNA sequences into the new bacterial taxonomy, Applied and Environmental Microbiology, 73, 5261-5267. [PubMed]
- Schloss, P.D., Westcott, S.L., Ryabin, T., Hall, J.R., Hartmann, M., Hollister, E.B., Lesniewski, R.A., Oakley, B.B., Parks, D.H., Robinson, C.J., Sahl, J.W., Stres, B., Thallinger, G.G., Van Horn, D.J. and Weber, C.F. (2009) Introducing mothur: open-source, platform-independent, community-supported software for describing and comparing microbial communities, Applied and Environmental Microbiology, 75, 7537-7541. [PubMed]
- Hartmann, M., Howes, C.G., Abarenkov, K., Mohn, W.W. and Nilsson, R.H. (2010) V-Xtractor: an open-source, high-throughput software tool to identify and extract hypervariable regions of small subunit (16S/18S) ribosomal RNA gene sequences, Journal of Microbiological Methods, 83, 250-253. [PubMed]
- DeSantis, T.Z., Hugenholtz, P., Larsen, N., Rojas, M., Brodie, E.L., Keller, K., Huber, T., Dalevi, D., Hu, P. and Andersen, G.L. (2006) Greengenes, a chimera-checked 16S rRNA gene database and workbench compatible with ARB, Applied and Environmental Microbiology, 72, 5069-5072. [PubMed]
- Li, W. and Godzik, A. (2006) Cd-hit: a fast program for clustering and comparing large sets of protein or nucleotide sequences, Bioinformatics (Oxford, England), 22, 1658-1659. [PubMed]
- Hao, X., Jiang, R. and Chen, T. (2011) Clustering 16S rRNA for OTU prediction: a method of unsupervised Bayesian clustering, Bioinformatics (Oxford, England), 27, 611-618. [PubMed]
- Lozupone, C., Lladser, M.E., Knights, D., Stombaugh, J. and Knight, R. (2011) UniFrac: an effective distance metric for microbial community comparison, The ISME journal, 5, 169-172. [PubMed]