Details
Web-Igloo visualizes multivariate data in a 2D chart of multiple quantitative variables represented as anchors on a semicircle. Our tool not only identifies clusters in your data but also allows to infer the features responsible for formation of the clusters. Projected data points can be easily mapped to class label information using a simple metadata file. View from among a list of examples or upload your own data into our server to generate a customized layout. Web-Igloo plots your multi-dimensional data keeping all the features intact without any feature decomposition.
Highlighted features include
- User selectable methods for positioning anchors and selecting normalization options
- Options to filter out non informative features
- BoxPlot summaries of anchor (or feature) distribution
- Interactively visualize sample and feature contributions using bar and bubble plots
- Easy mapping of multilevel class label information using a simple metadata file
- Convex hull prediction for class boundaries with automated coloring
- Simple and flexible search function to simultaneously visualize search outputs in plot as well as metadata table
- Interactively identify differentially abundant features across multiple classes using ANOVA
- Custom color selection for class labels
Click here to download a video demo
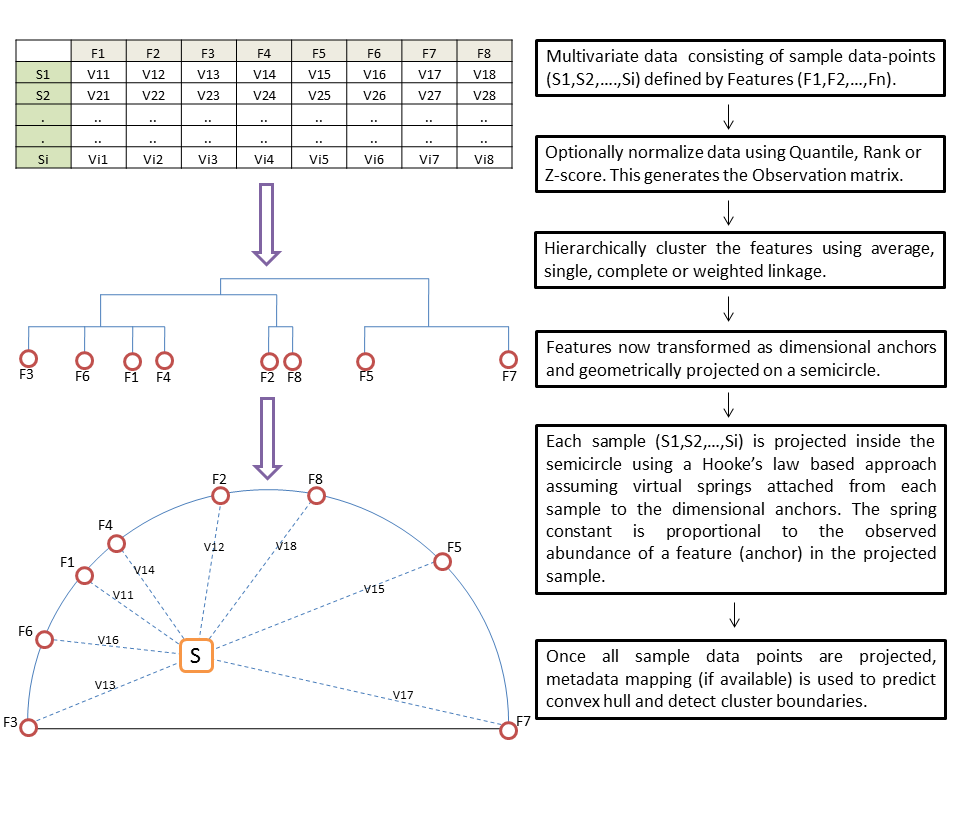
Algorithm
Citation
If you use Web-Igloo for your work please cite the following :