Welcome to Tutorials Section for iVikodak
Here we have attempted to provide you with precise guidelines for using iVikodak and its modules. You can use the left menu to fast-scroll across the content. Video tutorials have been associated with appropriate sections using icon.
About iVikodak
Motivation
The concept of using the exisiting databases of 'annotated microbial genomes' to infer functional potential of microbial communities, using 16S rRNA gene based amplicon sequencing, has provided a cost and time efficient alternative over WGS. While a handful of tools currently do exist for inferring mere 'function abundance tables or matrices', the scope of inference and analysis has remained very limited and a standard workflow is also lacking in this space of inferred function metagenomics.Methods and Functionalities (and utilities) that can help users decipher biologically meaningful insights need to be incorporated in the current scope of functional inference. Overall, the need for an end-to-end computational framework that incorporates a step-by-step logical work-flow for inferring functions from 16S taxonomic profiles, and goes beyond mere generation of function abundance profiles of an environment, is therefore felt.
iVikodak as a Solution
iVikodak is a substantially improved version of Vikodak (Nagpal et al., 2016) (PMID:26848568 ), developed with an objective of establishing a standard workflow and creating a one stop solution for inferring, analysing, comparing, and visualizing the Functional Potential of Microbial Communities. Three logically connected analytical modules of iVikodak are aimed at –
(a) inferring the 'generic' functional attributes of given microbial communities
(b) comparing/ co-relating and/ or overlaying the taxonomic and predicted functions with available sampling (phenotypic) metadata, and
(c) drilling down to and in-depth probing of specific functions of interest in the context of taxonomic contributions of participating microbes
iVikodak facilitates end-users to concomitantly infer, statistically analyse, and compare multiple microbial communities, and in the process generate a plethora of intuitive self-explanatory visual outputs in an automated fashion.
Four Modules: 3 Core and 1 Recreator Module of iVikodak
Global Mapper: The function inference module (Click for details)
Feature Analyzer: The comparative analysis module (Click for details)
Local Mapper: The pathway probing tool (Click for details)
Following is a quick access to the three core modules of iVikodak:
Besides the three core modules there is one auxiliary module as well (Reactor Module). It is this module which enables end users to realize the portability, sharability and universal accessibility of iVikodak Dashboards (Click for details)
Input Data and Meta Data Formats
Input Data for Global Mapper and Local Mapper
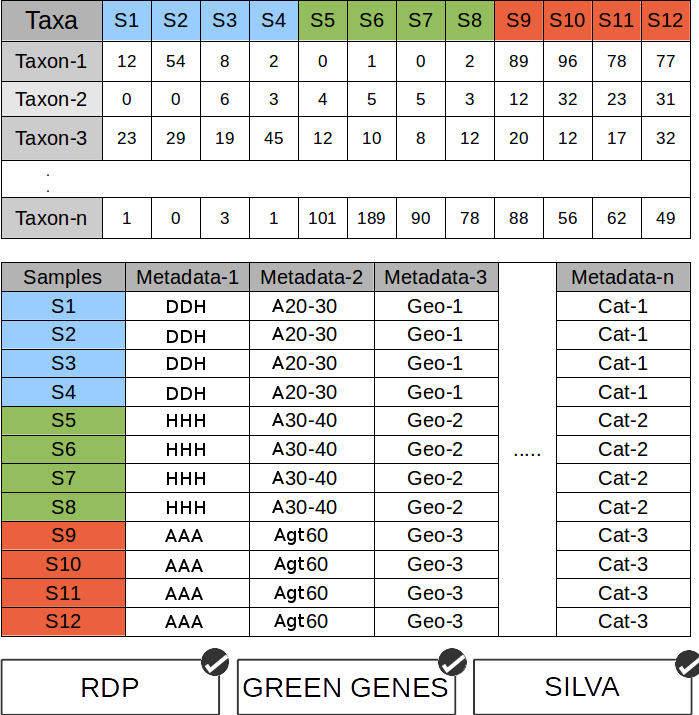
Input data for Global Mapper as well as for Local Mapper is a tab-separated file containing multivariate microbial abundance profile/ data. First row contains the names of samples, while first column contains the names (as generated by RDP or Silva) or Green Gene (v13.5) IDs of the microbes.
iVikodak (and all its modules) can auto-detect the data type (RDP, Silva or GG), so you don't have to tell us what format your data belongs to.
Meta Data for Global Mapper and Local Mapper
Meta data for Global Mapper as well as Local Mapper is a tab-separated file containing multiple columns of sample information. First row contains the names of various meta data classes, while first column contains the names of the samples (as present in the input data).
Each column of meta data file, representing various classes of environments, contains the names of various sub-classes in each environment.
Input Data for Feature Analyzer
Input data for ISFA is either a tab-separated file containing multivariate function abundance profile/ data obtained from Global Mapper; or a Functional.Profiles.at.PECs.zip obtained from Global Mapper. The former format is applicable for Rapid mode of operation while the later is applicable for Batch mode.
Meta Data for Feature Analyzer
Meta data for ISFA is a tab-separated file containing multiple columns of sample information. First row contains the names of various meta data classes, while first column contains the names of the samples (as present in the input data).
Each column of meta data file, representing various classes of environments, contains the names of various sub-classes in each environment.
JOB-ID Management
All modules of iVikodak follow a unique 10-character alphanumeric JOB ID based job handling and perform all analyses without seeking any personal information. Coupled to that, each JOB ID is subsequently tagged to a personal Dashboard, which packages and presents all visualizations and results. All the dashboards, corresponding to user-specific job IDs, can be downloaded as unique 'dash files' which can be retained and shared by the end-users for future re-explorations. The 'dash files' can be uploaded to the specifically developed 'Recreator' module of iVikodak, which recreates an entire dashboard using the unique dash file.
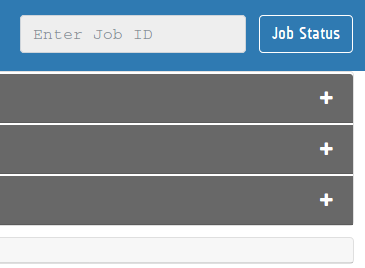
One can access the Results by pasting the unique JOB ID into the JOB Status input fields provided on top of each module of iVikodak in both the Themes (following are the snapshots):

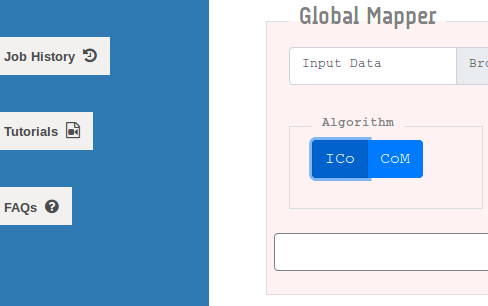
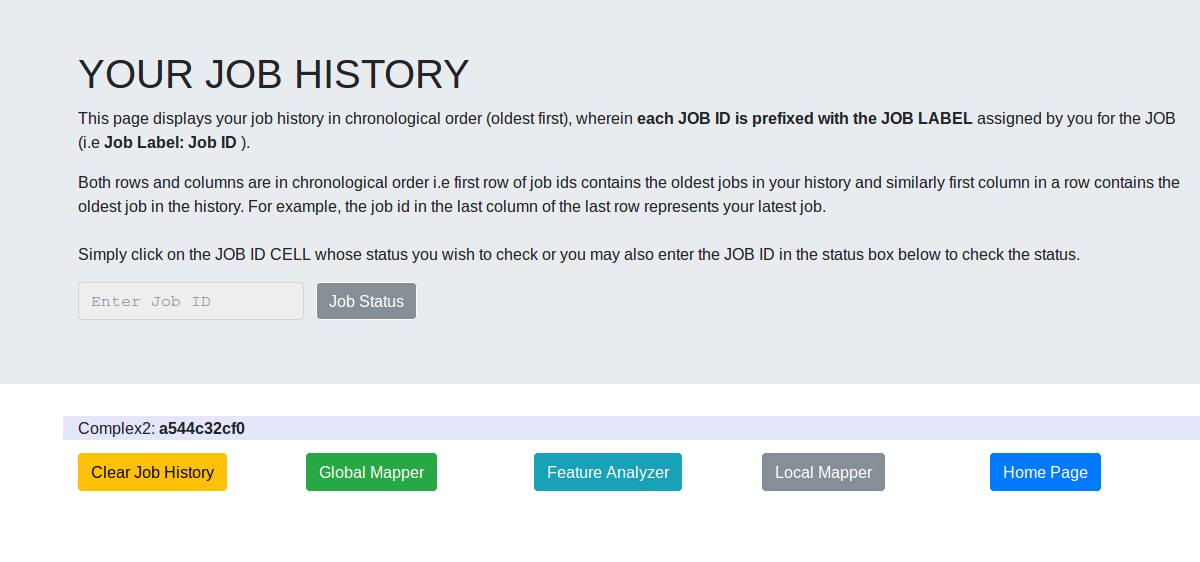
One can also access his/ her JOB History on iVikodak using the floating button on the right side of the execution section of each module in the Deep Theme mode and using the navigation bars in the Lite Theme (following is a snapshot):
Clicking the JOB History button shows a pop-up notification on the bottom right of the screen, displaying the number of jobs in your current history, and a button to access your JOB History page (following is a snapshot):
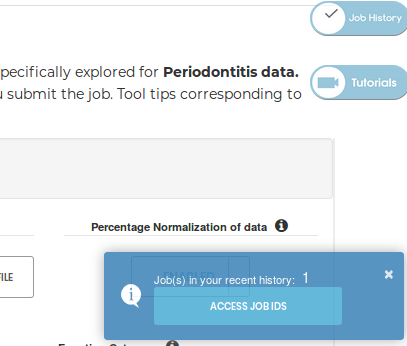
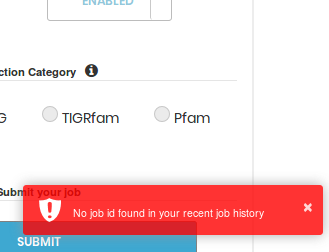
If a history exists, you'll be able to access the same using the Access JOB IDs button provided in the notification:
Output Data and Results
Each module of iVikodak generated two broad category of outputs or results:
(a). Ensemble of Textual Results
(b). Ensemble of Visual, Interactive Results in personalized Dashboards
Textual Results
Each module of iVikodak generates a comprehensive ensemble of textual matrices or files corresponding to module specific functional inference and analytical workflows.
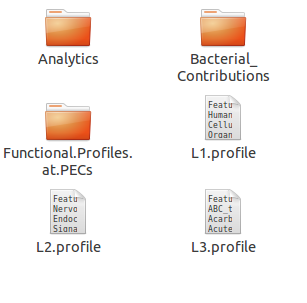
For example, the textual esemble of Global Mapper results typically comprises of the following kind of files:
- 1. Raw Function Abundance Profiles
- Unfiltered Function abundance profiles for all samples of the environment are provided as L3.profile.txt, L2.profile.txt and L1.profile.txt. L3,L2 and L1 represent the specific levels of functional hierarchy.
- 2. Function Abundance Profiles at PEC Thresholds
- The functional abundance profiles are inferred for all levels of hierarchy at PEC 50 - 90 thresholds (what is PEC?) and provided in well stuctured directories.
- 3. Bacterial Contributions
- Functional contributions by various microbes in the environment in each class of samples is appropriately segregated and presented in well structured directories. Contributions at various PEC thresholds are also provided in separate directory structure.
- 4. Analysis Directory
- A directory containing various analysis outputs like Core Functions, Top Functions, Networks, Differentiating Functions, Ordination is also provided. A separate sub-directory exists for each kind of analysis and contains multiple files pertaining to that analysis.
- and more..
Following are snapshots of a typical main directory of results:
A similar kind of structure and module specific ensemble of textual results are created for ISFA and Local Mapper as well.
Visual and Graphical Results (DASHBOARDS)
Each job execution on every module of iVikodak is tagged to a unique JOB ID which in turn is linked to a full-fledged dashboard of results and analyses. A dashboard represents an ensemble of carefully compiled personalized web-page that showcases various graphs, interactive, visualizations, tables and downloadable files specific to the module it corresponds to.
Each module has its own style and content of Dashboard, and each user gets a personal, independent dashboard for each job he/ she executes on any module of iVikodak.
Following are direct links and snapshots of sample dashboards specific to Global Mapper, Feature Analyzer and Local Mapper:


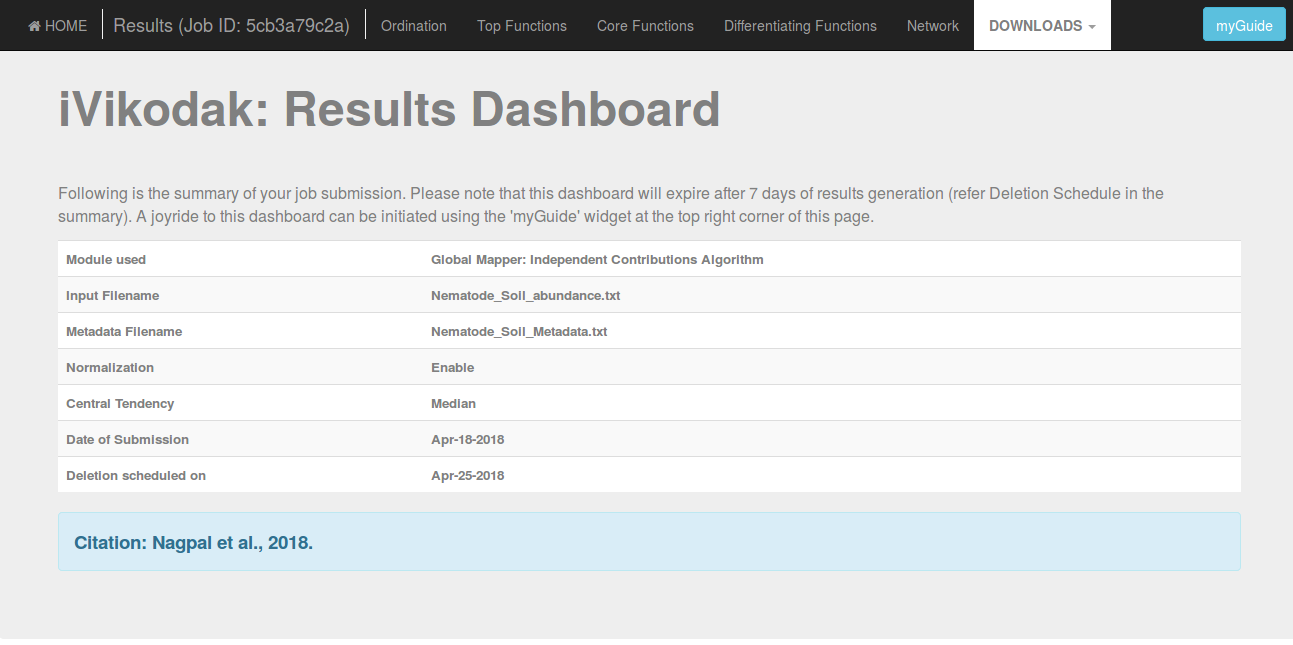
Welcome Section
This is how a dashboard typically looks as soon as it opens
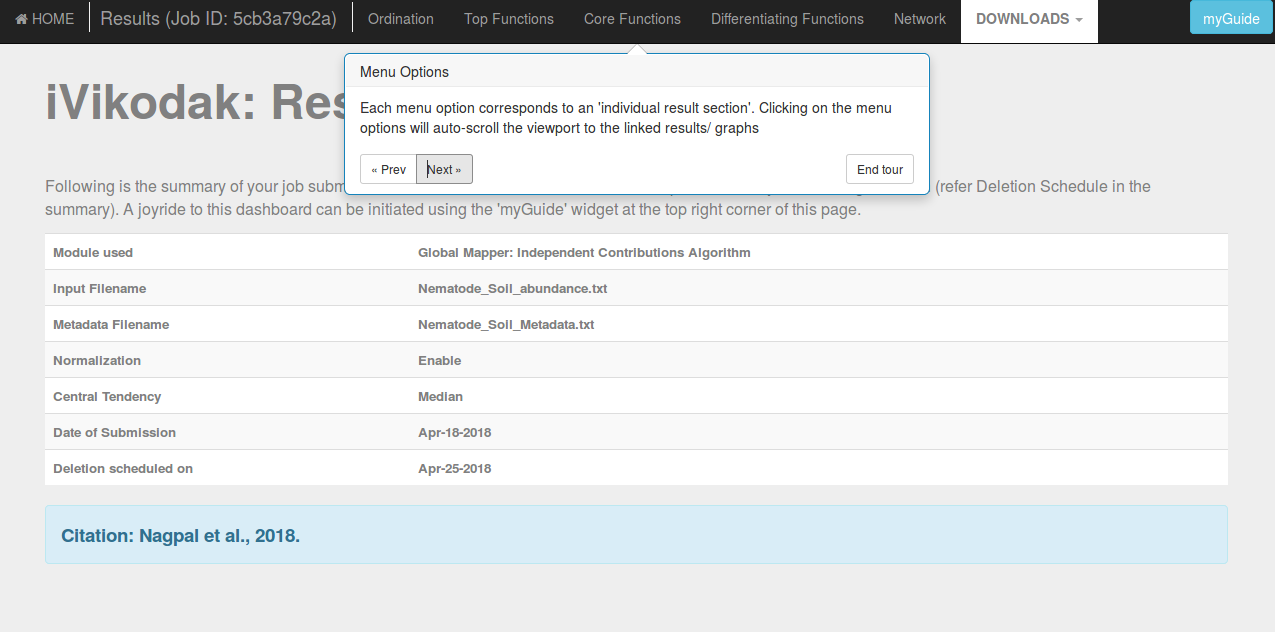
Dashboard Tour
A user can initiate a guided tour to the dashboard
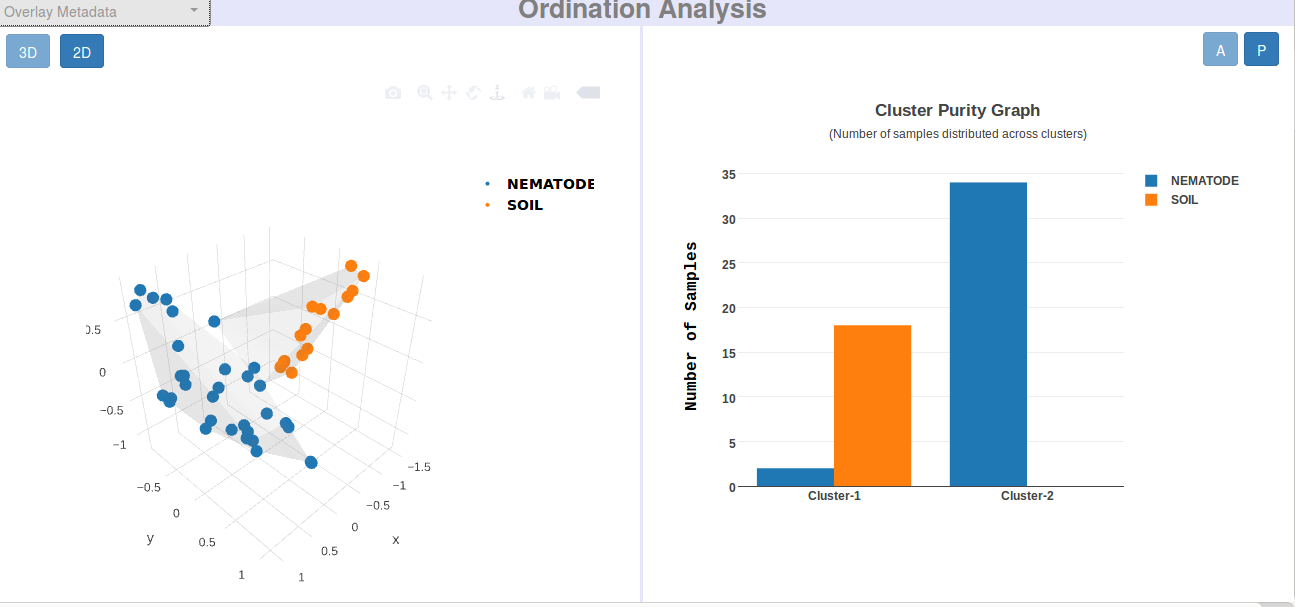
Ordination Section
One of the graph visualization section of Global Mapper
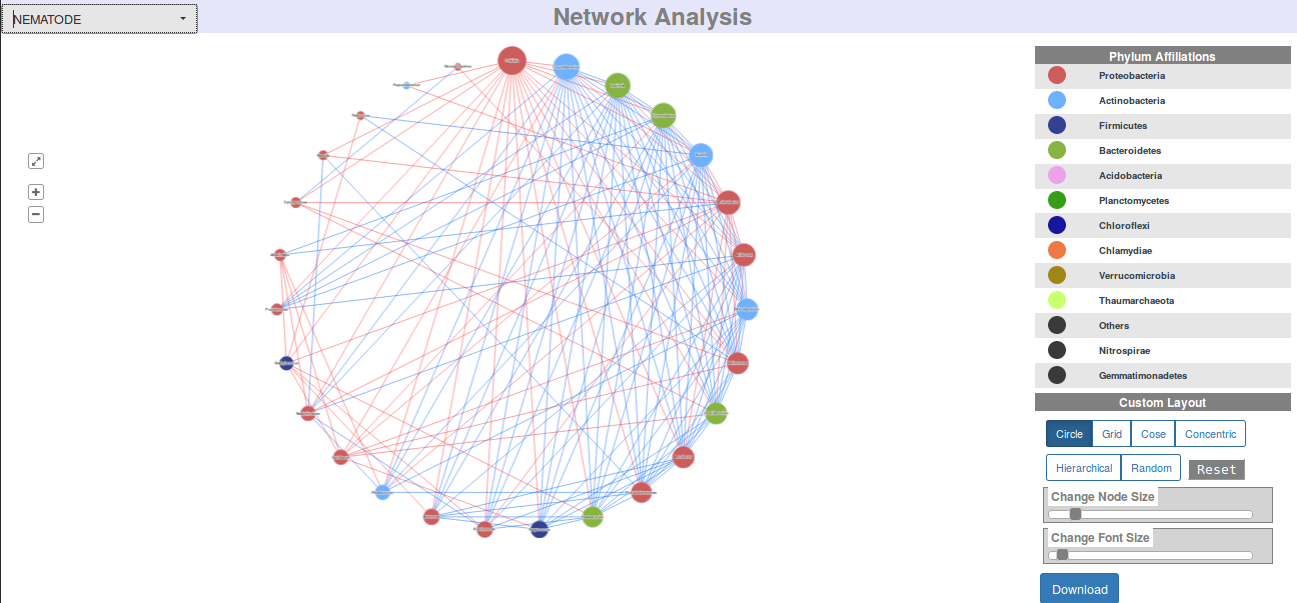
Network Section
Another graph visualization section of Global Mapper
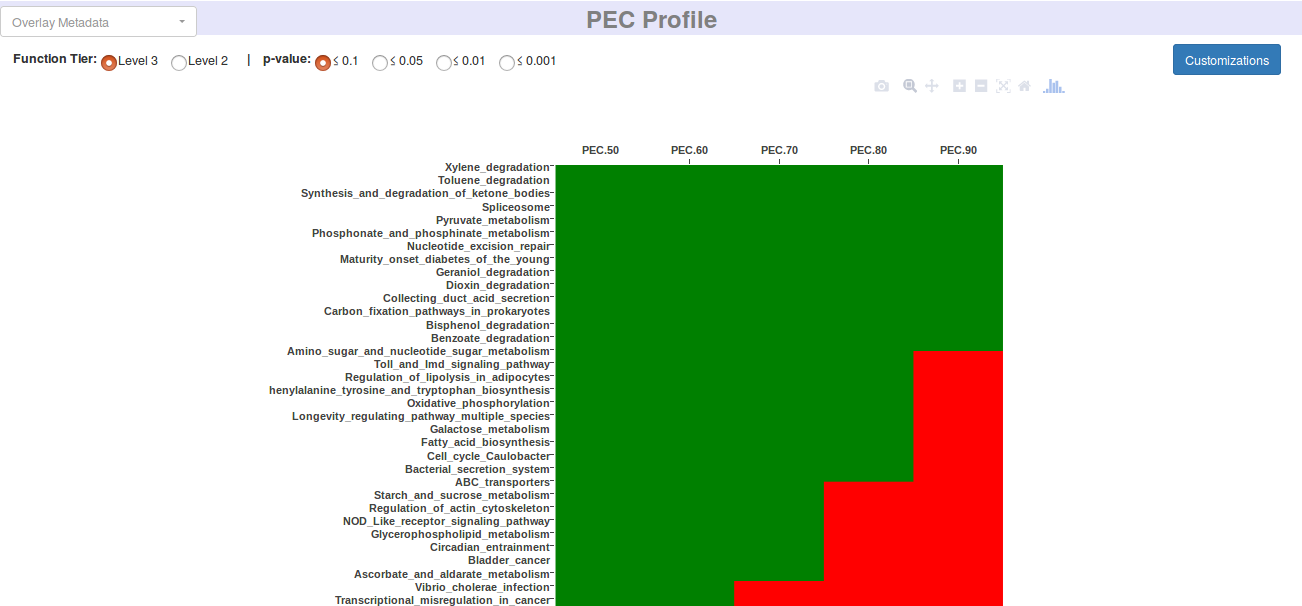
PEC Profile Section
A graph visualization section of Feature Analyzer Module
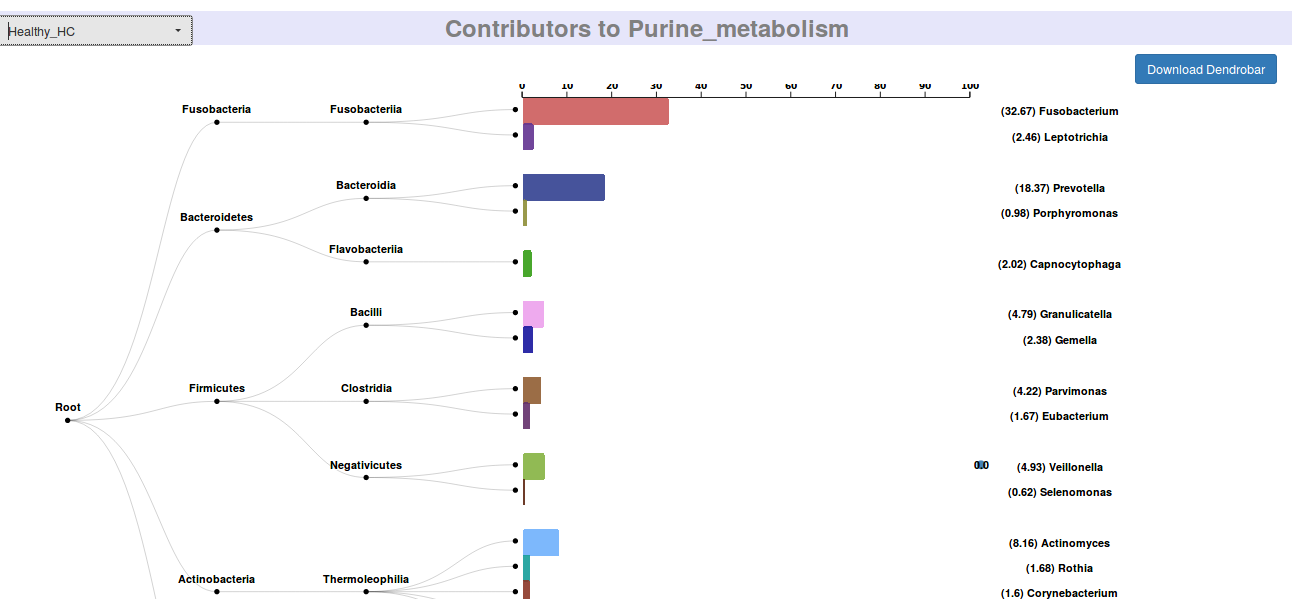
Dendro Bar Section
A graph visualization section of Local Mapper Module
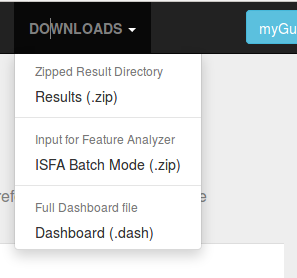
.dash Files
The concept of .dash files and Recreator module of iVikodak enables permanent retention, portability, and sharability of the personal Dashboards.
As already introduced, iVikodak follows a unique 10-character alphanumeric JOB ID driven job handling and performs all analyses without seeking any personal information. Each JOB ID is subsequently tagged to a personal Dashboard, which packages and presents all visualizations and results.
All the dashboards, corresponding to user-specific job IDs, can be downloaded as unique '.dash files' which can be retained and shared by the end-users for future re-explorations. The 'dash files' can be uploaded to the specifically developed 'Recreator' module of iVikodak, which recreates an entire dashboard using the unique dash file.
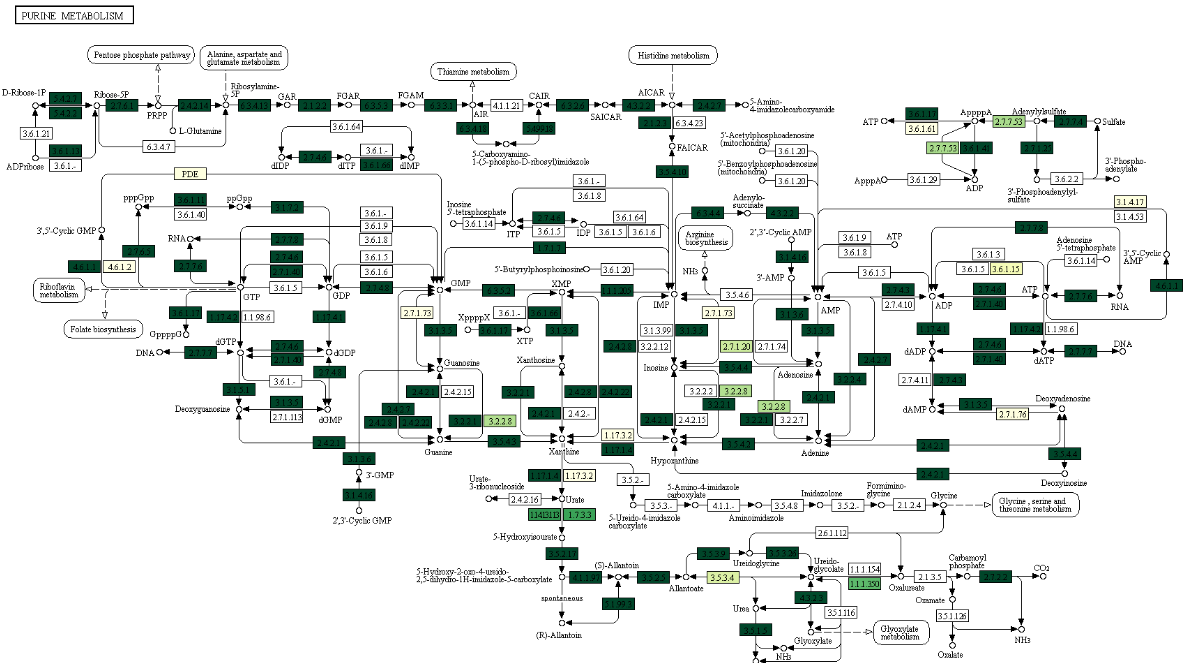
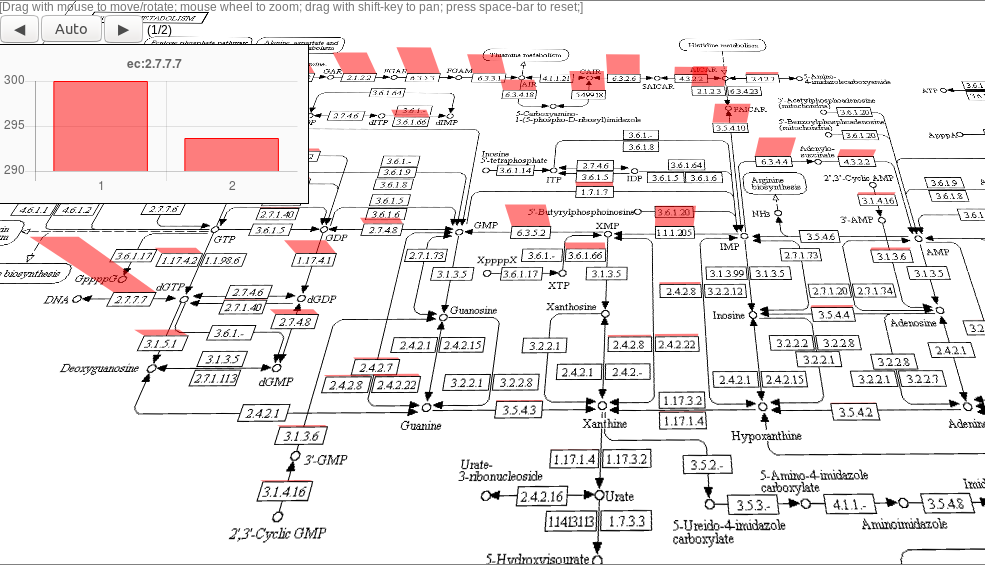
Creating KEGG Color and 3D Maps
The Local Mapper module of iVikodak generates pathway specific (as chosen by end user) KEGG color map and KEGG 3D map files for each class of samples (as supplied in metadata), which can be uploaded to the KEGG webserver (Link here) to generate colored and 3D visualizations of pathway of interest.
Following is a snapshot of the Local Mapper result dasboard section specific to KEGG map files:
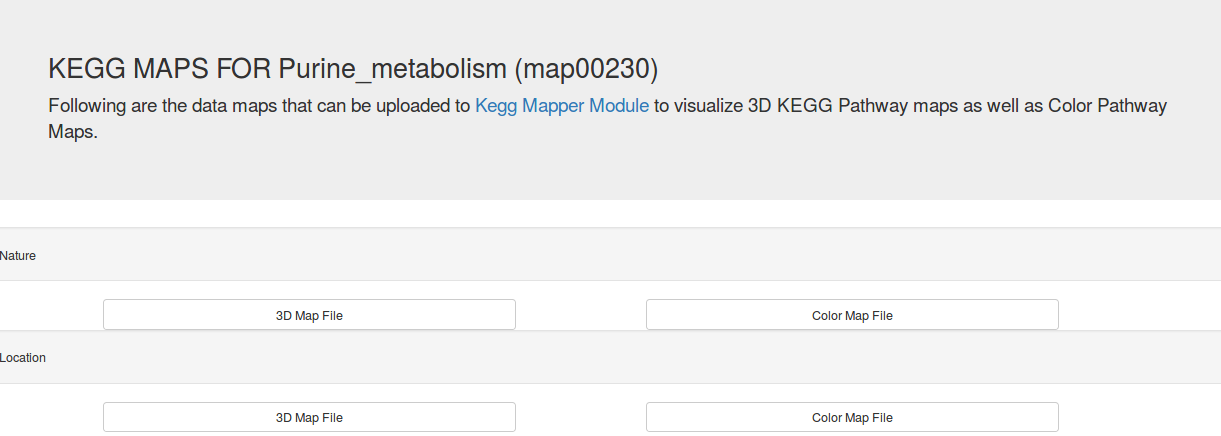
Following are snapshots of sample color maps and 3D maps:
More Tutorials
We hope that this documentation helped you in understanding iVikodak and its functionalities to some extent. You will find more assistance in each module of iVikodak through module specific Video Tutorials and assistive tool tips as well as guided tours in the dashboards. If there is any query that needs to be addressed, feel free to reach out to us at sunil.nagpal@tcs.com.
Thank you for your time and interest.