OTUX provides a set of databases for various v-regions or their stretches. As we know, in 16S rRNAS research, different studies may target different v-regions. So, to enable cross-comparison of results obtained from OTUX, we have created a mapping back matrix. Using this matrix one can map-back the results obtained in terms of OTUX OTU IDs to Greengenes OTU IDs, which is one of the widely used reference database for OTU picking.
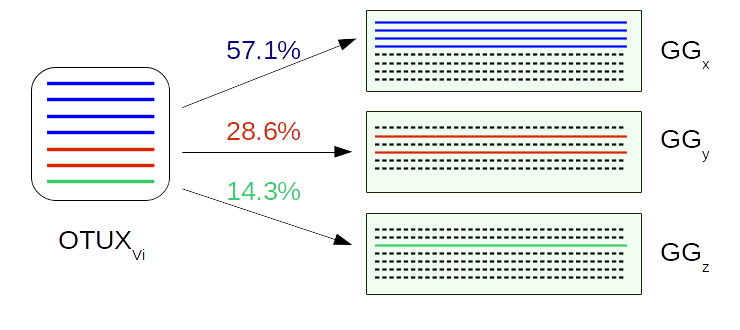
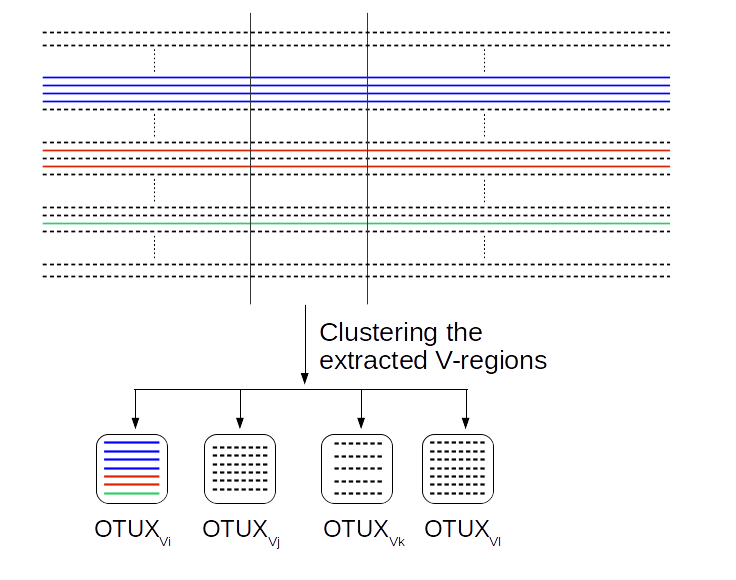
The OTUX database was created using the ‘prokMSA’ unaligned sequences from Greengenes database (v13.8) along with their taxonomic classification as well as Greengenes OTU IDs. We extracted the V regions from each sequence present in the database. The extracted sequences were then clustered based on sequence similarity using CD-HIT, wherein each resultant cluster constitutes sequences which shared 99% sequence identity with each other. Each cluster was assigned a v-region specific OTUXV ID and was compiled to constitute a OTUXV reference database for that v-region or a stretch of v-regions. The following procedure is explained using V4 region as an example. After compiling the OTUX databases, we calculated the propensity of a OTUXV4 ID (OTUXV4i) to be associated to a Greengenes OTU ID (GGj) using the following formula,
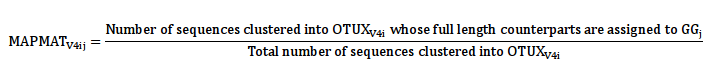
The propensity matrix MAPMATV4, for the OTUXV4 database, is then populated by computing all values for MAPMATV4ij where,
- i = 1 to NOTUX, where NOTUX is the total number of OTUXV4 OTUs
- j = 1 to NGG, where NGG is the total number of Greengenes OTUs
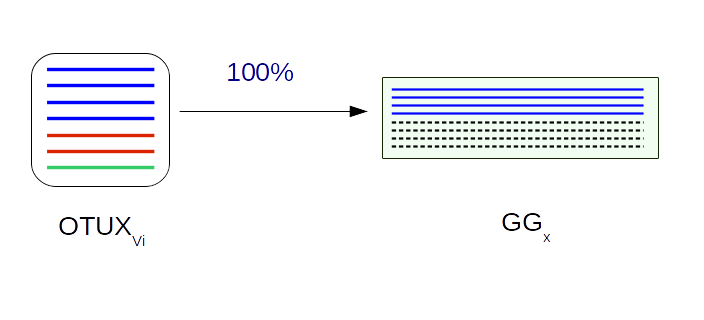
Now we have a mapping back matrix MAPMATV4, which is a NGG × NOTUX matrix. This matrix can now be used to map-back the classification results obtained in terms of OTUXV4 OTUs to represent the results in terms of Greengenes (v13.8) OTU IDs. This mapping back can be either be ‘one-to-one mapping’ or ‘one-to-many mapping’ depending on the user criteria.
In this procedure each of the query sequences is assigned to particular Greengenes OTU IDs. For a particular query sequence ‘s’ which has been assigned to the OTU OTUXV4x, the MAPMATV4 elements {MAPMATV4xj} are retrieved (wherein ‘j’ = 1 to NGG i.e. the total no. of Greengenes OTUs).The maximum value of {MAPMATV4xj} is computed. The sequence ‘s’ is classified to the Greengenes OTU ‘y’ (GGy), wherein MAPMATV4xy = max{MAPMATV4xj}. The process is repeated for all query sequences and subsequently an OTU abundance table (TGG), in terms of Greengenes OTU IDs, is generated by cumulating the total number of sequenced reads from the given metagenomic sample that could be classified/ attributed to each of the Greengenes OTUs.
This mapping is used to represent the abundance profile of a microbial community structure pertaining to a given metagenomic sample, wherein the abundance of each microbe (OTU) is represented in terms percentage normalized values. To begin with, for a set of query sequences corresponding to a metagenomic sample, the abundance table/profile TOTUX is generated wherein the total number of sequences assigned to each of the OTUXV4 OTUs are represented. For example, TOTUX can be represented in form of a column matrix (of size NOTUX × 1) as depicted above wherein ‘i’ varies from 1 NOTUX , i.e. the total number of OTUXV4 OTUs, and wherein ‘a’ is the number of sequences assigned to the OTU OTUXV41, ‘b’ is the number of sequences assigned to OTUXV42, ‘c’ is the number of sequences assigned to OTUXV43, and so on. Next, an OTU abundance table/profile (TGGraw) is obtained for the set of query sequences, in terms of Greeengenes OTU IDs by multiplying the matrix MAPMATV4 with the matrix TOTUX. It may be noted that given the nature of the MAPMAT matrix, the abundance values for each of the Greengenes OTUs in TGGraw may be a fractional value.
TGGraw = MAPMATV4 × TOTUX
Wherein, TGGraw is a column matrix of size (NGG × 1), and NGG is the total number of Greengenes OTUs. Finally a percentage normalized OTU abundance table/profile (TGG%) is obtained by performing the following transformation on each element of TGGraw
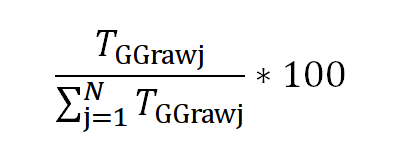
Wherein, TGG% is a column matrix of size (NGG×1), and NGG is the total number of Greengenes OTUs. The abundance of taxonomic groups present in the metagenomic sample, as obtained in the form of either of the three column matrices, viz. TOTUX, TGG and TGG%, are further represented at any desired taxonomic level utilizing the taxonomic hierarchy information associated with the Greengenes OTUs.